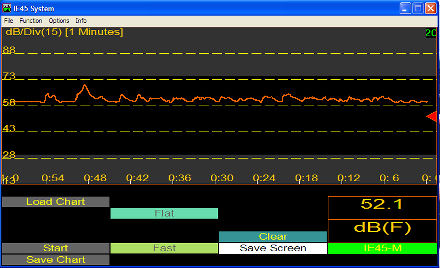
IE-45 Strip Chart
This wonderful feature is reminiscent of the days of the old paper strip chart recorders. There have been many improvements in instrumentation since those days, but the strip chart concept still offers the best graphic depiction of amplitude over time. The Strip Chart function can record amplitude over time from 1 minute to 8 hours, plus a continuous recording mode. The finished chart can be saved to a tab-delimited ASCII character file and transferred to a PC for further display and manipulation, using Ivie's "IvieXLS" graphing software or any other compatible means.
Weighting and Filtering - All of the SPL detectors can be applied to Strip Chart as can the weighting and filtering.
Chart Time - Chart Time settings allow the user to select the amount of time it takes the strip chart “pen” to trace a line from the far right of the display to the far left. Minimum time is 1 minute, maximum is 8 hours, and there is “continuous” setting as well.
Set dB Scale - As in the RTA display, this function allows the user to set the amplitude resolution of the display.